
When conversion rates fall unexpectedly, the urgency to diagnose and restore performance becomes paramount for brands operating with healthy margins. The challenge lies in isolating root causes quickly without access to a dedicated analytics team. A structured diagnostic approach combining traffic verification, payment integrity checks, and AI-assisted analysis enables founders to identify conversion leaks and implement targeted fixes.
Conversion Rate Benchmarks and Baseline Performance
Understanding baseline performance provides context for diagnosing deviations. The global average e-commerce conversion rate stands at 1.89% across all industries and store sizes[1]. Shopify stores average conversion rates between 2.5-3%[1].
Sector performance varies considerably. Beauty and wellness e-commerce sectors achieve conversion rates up to 6.8%, significantly outperforming fashion at 1.6-1.9%[1]. This variance suggests that category-specific benchmarks provide more useful diagnostic context than cross-industry averages.
Device performance reveals a persistent gap. Desktop conversion rate reaches 3.9% while mobile lags at 1.8%, representing a 54% performance gap between devices[1]. Given that mobile traffic accounts for a growing share of requests, device-specific diagnostics are increasingly relevant.
The relationship between add-to-cart behavior and completed transactions offers diagnostic insight. Add-to-cart rate averages 7.52% of sessions, with less than one-third of carts converting to completed orders[1]. This metric helps isolate whether conversion issues stem from product page engagement or checkout completion.

Flowchart illustrating how traffic patterns, add-to-cart rates, and device-specific conversion gaps guide diagnostic prioritization
Cart Abandonment and Checkout Friction
Cart abandonment represents a substantial conversion leak across the industry. Global cart abandonment rate stands at 70.22% according to Baymard Institute's meta-analysis of studies[2]. Mobile shopping cart abandonment reaches 78.74%, compared to tablet at 70.26% and desktop at 66.74%[2].
Unexpected costs, including shipping fees, cause 48-55% of cart abandonment, with price transparency alone recovering more carts than discount strategies[2]. This finding suggests that diagnostic efforts should examine cost presentation and transparency before implementing promotional interventions.
Checkout optimization can increase conversions by 35.26% through UX improvements alone[2]. The average checkout form contains 23.48 form elements and 14.88 form fields, with 34% of shoppers abandoning due to checkout form length[3].
When diagnosing conversion drops, examining checkout field requirements and form complexity may reveal friction points that developed through incremental feature additions. A practical diagnostic step involves comparing the current checkout flow against historical configurations to identify recent changes that correlate with conversion decline.
Payment Gateway Issues and Checkout Failures
Payment processing failures represent a critical but often overlooked conversion leak. Up to 30% of customers intending to purchase abandon checkout due to payment gateway issues, including declined cards and security concerns[4].
Payment abandonment breaks down into specific categories: insufficient payment methods account for 13%, card declines for 9%, and trust concerns for 18%[4]. This distribution suggests that diagnostic protocols should verify payment method availability and gateway response codes as distinct troubleshooting steps.
Authorization rate fluctuations can substantially impact revenue. A 1% drop in authorization rate can cost millions in annual lost revenue at scale, while 0.5% improvement captures millions in additional revenue[5]. For brands experiencing sudden conversion drops, examining authorization rate trends may reveal gateway configuration changes or processor issues.
Accelerated checkout options show measurable conversion differences. Shopify's integrated Shop Pay lifts conversion by up to 50% compared to guest checkout and outpaces other accelerated checkouts by at least 10%[6]. Verifying that accelerated checkout options remain properly configured represents a practical diagnostic step.
Site Speed and Technical Performance Impact
Technical performance directly correlates with conversion outcomes. A 0.1-second improvement in site speed leads to an 8-10% increase in conversion rates for retail and 8% increase in average order value[6].
Pages loading in 2.4 seconds achieve 1.9% conversion versus 0.6% at 5.7+ seconds, demonstrating 68% performance impact from site speed[1]. Walmart reports that each 1-second faster page delivery produces 2% higher conversions, with Core Web Vitals updates making this an official ranking factor[1].
Slow website performance can increase cart abandonment by 75% and reduce loyalty by 50%[3]. When diagnosing conversion drops, monitoring page load time by device type and connection speed may reveal performance degradation that coincides with conversion decline.
Practical diagnostic steps include running speed tests on product pages and checkout flows, examining third-party script load times, and verifying that recent app installations have not introduced render-blocking resources. Performance monitoring tools can identify whether conversion drops correlate with deployment timestamps or infrastructure changes.
AI-Powered Diagnostics and Conversational BI Tools
Emerging diagnostic tools enable non-technical operators to surface insights through natural language queries. Amazon Seller Central launched an AI-powered canvas experience enabling merchants to ask natural language questions about advertising, sales, and conversion data without manual reporting[7].
Shopify Winter update introduced enhancements, including Sidekick Pulse for analyzing data, generating tasks, and automating workflows in natural language[7]. Conversational business intelligence tools using natural language queries are emerging across platforms like Power BI, Looker, and Qlik to replace static dashboards and manual reporting[7].
These tools may accelerate diagnostic workflows by allowing operators to query conversion funnels, compare time periods, and segment performance without constructing manual reports. Sample queries might include examining conversion rate by traffic source, identifying checkout abandonment points, or comparing device-specific performance across date ranges.
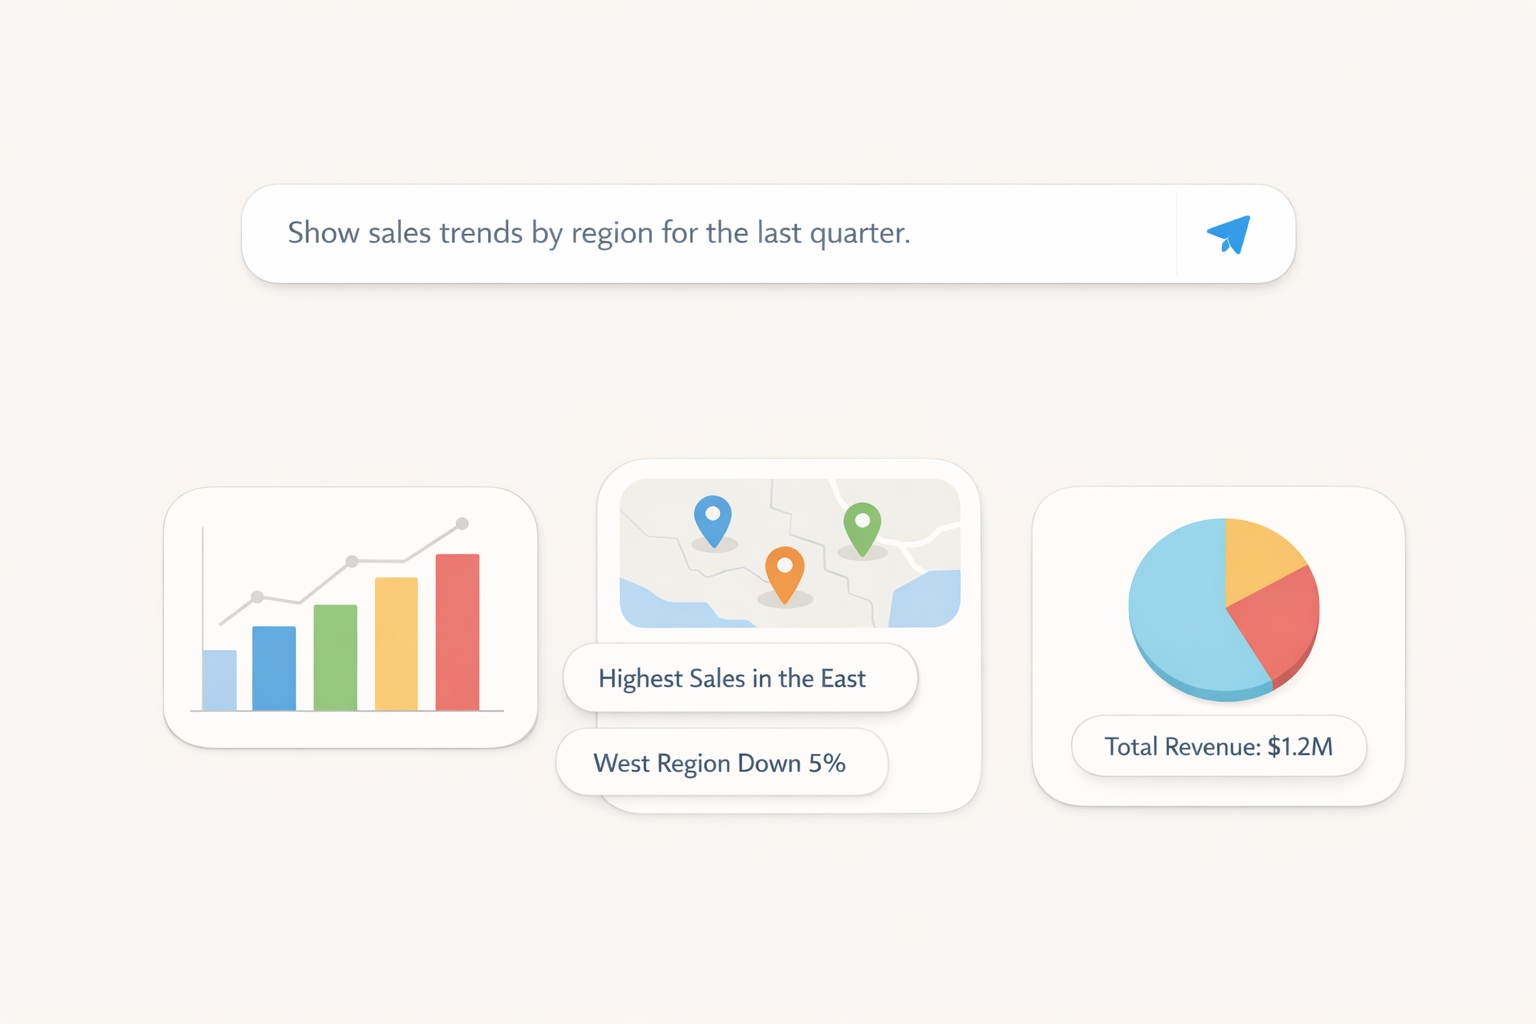
Illustration of conversational business intelligence interface where natural language questions surface conversion funnel insights without manual report construction
Experimentation Framework and Quick Tests
Structured experimentation helps isolate conversion variables and validate fixes. Companies using product personalization report average conversion uplifts of 150% compared to traditional static product flows[8]. Streamlined checkout processes alone can boost conversions by up to 35%[8].
Test sequencing affects algorithm performance. Running overlapping tests can increase CPA (Cost per acquisition) due to algorithm learning phase disruption, making structured experimentation important[9]. This constraint suggests that diagnostic experiments should be isolated and sequential rather than concurrent.
Abandoned cart emails achieve 18.64% average conversion rate with 45% open rate and 10.7% transaction recovery rate[3]. When diagnosing conversion drops, verifying that automated recovery sequences remain active and properly triggered represents a practical troubleshooting step.
Quick diagnostic experiments may include testing alternative product page layouts, simplifying checkout field requirements, or re-enabling previously paused audience segments to determine whether recent changes correlate with conversion decline. Establishing a baseline measurement period before implementing changes allows for clear attribution of recovery effects.
Inventory and Pricing Impact on Conversion
Inventory availability, review credibility, and conversion friction represent core leaks in sales systems[10]. This prioritization framework suggests that diagnostic protocols should verify inventory accuracy before examining marketing variables.
Review momentum correlates with conversion performance. Research indicates that 98% of shoppers say reviews are an essential resource, with review momentum stalls correlating directly to conversion rate drops despite steady traffic[10]. When diagnosing conversion declines, examining review velocity and rating distribution may reveal credibility signals that have weakened.
False demand signals from promotions, ad bursts, and price changes can mask real demand trends[10]. This finding suggests that diagnostic analysis should account for promotional calendar effects and compare performance across similar non-promotional periods.
Practical inventory diagnostic steps include verifying that stock levels display accurately, confirming that out-of-stock items are properly tagged to prevent ad spend waste, and checking that pricing updates have propagated correctly across all product variants and sales channels.
Conversion rate, add-to-cart rate, and checkout completion metrics showing performance restoration following diagnostic fixes
Subscription Metrics and Retention Economics
For subscription-based models, specific metrics provide diagnostic insight into conversion and retention health. Monthly recurring revenue serves as a foundation for evaluating stability and scalability, with segmentation by product line revealing sustainable revenue sources.
Churn rate is a signal of customer satisfaction and product-market fit, with high churn eroding predictable revenue and forcing costly acquisition cycles. When subscription brands experience conversion drops, examining whether churn has increased concurrently may reveal product or service quality issues affecting both new acquisition and existing retention.
Cancellation recovery rate measures the percentage of customers staying after beginning cancellation, with high rates indicating effective retention flows and targeting. Verifying that cancellation save flows remain properly configured and triggered represents a practical diagnostic step for subscription models experiencing revenue decline.
Market Context and Revenue Performance
Understanding broader market dynamics provides context for interpreting conversion fluctuations. U.S. DTC e-commerce reached a substantial revenue figure in recent years, representing 19.2% of total retail e-commerce, with projected growth continuing[12].
Despite this growth trajectory, mid-market DTC EBITDA margins have compressed to 7-8%, with nearly half of DTC founders citing profitability as a top challenge[12].
Subscription models show particular retention value. Research indicates that 36% of consumers purchase through repeat subscription models, with subscription-driven DTC brands reporting higher lifetime value than one-time purchase brands.
This market context suggests that conversion optimization and diagnostic capability have become table stakes for maintaining profitability as customer acquisition costs rise and margin pressures intensify across the DTC sector.
Practical Diagnostic Workflow
A structured diagnostic approach begins with traffic verification. Confirming that advertising campaigns remain active, budgets have not been exhausted, and landing pages return proper status codes eliminates the most common external causes of conversion drops. Analytics verification follows, including confirming that tracking pixels fire correctly, tag management configurations remain intact, and data flows to reporting platforms without interruption.
Payment method availability checks represent a frequently overlooked diagnostic step. Verifying that all intended payment options display at checkout, testing transactions through each payment method, and reviewing gateway logs for authorization decline patterns can reveal issues that affect substantial portions of checkout attempts.
Checkout flow testing across devices and browsers helps identify device-specific or browser-specific rendering issues that may have been introduced through recent code deployments or third-party script updates. Completing test transactions on mobile devices using different connection speeds can surface performance issues that affect real customer experiences.
Inventory accuracy verification ensures that displayed stock levels match actual availability, out-of-stock items are properly excluded from advertising, and variant-level inventory data propagates correctly across all sales channels. Pricing consistency checks confirm that promotional pricing displays correctly and that no unintended price changes have been applied to high-volume SKUs.
Once technical and operational factors have been verified, attention can shift to marketing variables, including audience targeting, ad creative performance, and landing page relevance. This sequenced approach prevents premature optimization of marketing variables when underlying technical or operational issues are responsible for conversion decline.
Measurement and Recovery Validation
Establishing clear measurement protocols enables validation of diagnostic findings and recovery interventions. Key performance indicators to monitor include conversion rate, add-to-cart rate, checkout abandonment rate, and average order value. Tracking these metrics at granular levels—by device type, traffic source, product category, and customer segment—provides diagnostic resolution that aggregate metrics cannot offer.
When implementing fixes based on diagnostic findings, consider establishing measurement windows that account for algorithm learning periods and statistical significance thresholds. Comparing performance across equivalent time periods while controlling for promotional calendar effects helps isolate the impact of specific interventions.
Documentation of root causes and recovery actions creates institutional knowledge for future diagnostic efforts. Recording which diagnostic steps identified issues, which interventions restored performance, and how long recovery took enables pattern recognition across multiple incidents and informs prioritization of monitoring investments.
Automated monitoring can provide a warning of conversion anomalies before they accumulate into a substantial revenue impact. Setting threshold alerts for conversion rate declines, checkout abandonment increases, or payment authorization rate drops enables a response to emerging issues.
Consider establishing a cadence for running diagnostic checks even in the absence of obvious performance issues. Proactive diagnostics can identify gradual degradation in site speed, incremental increases in checkout friction, or slow erosion of review momentum before these factors compound into measurable conversion decline.
The diagnostic framework outlined here provides a structured approach to isolating conversion leaks and validating recovery interventions. By combining traffic verification, payment integrity checks, technical performance monitoring, and AI-assisted analysis, operators can restore performance without requiring dedicated analytics teams.
What diagnostic blind spots have you encountered when troubleshooting conversion drops in your own operations?


SUBMIT YOUR COMMENT