

Expanding feels tempting — new lines, new audiences. But many brands dilute the core and grow discount-dependent. The evidence on this tension is instructive: Allbirds saw net revenue increase 7.3% and units sold increase 8.4% in 2022, yet gross margin fell to 43.5% from 52.9% [1]. Meanwhile, adjacency done well can pay off, as Warby Parker's average revenue per customer rose to $307 from $287 when customers added contacts or eye exams to glasses purchases [2]. The difference between these outcomes is rarely luck; it is architecture.
When Extension Erodes the Core
Allbirds recorded $19.1 million of inventory-optimization costs, while inventory write-downs, liquidation, and promotions reduced gross profit by $17.1 million [1]. These figures show how expansion pressure can translate directly into margin pressure once excess inventory forces discounting. When a brand grows units without protecting profitability, the promotional habit becomes structural rather than seasonal.
That risk is not confined to a single company. Across 35 retailers, discounted products generated 54% of revenue, appeared in 52% of transactions, and represented 49% of items sold [3]. This concentration of revenue behind discounts shows how quickly promotion can shift from a tactic to a dependency. Architecture decisions that push a brand toward constant markdowns quietly reset customer expectations about what the brand should cost.
Standalone ventures carry their own version of this danger. Lululemon recognized $442.7 million of post-tax impairment and other charges related to its Lululemon Studio business, formerly MIRROR [4]. A separate venture that drifts far from the core promise can absorb capital without strengthening the flagship. The cost of an architecture mistake is therefore measured in both diluted focus and written-down investment.
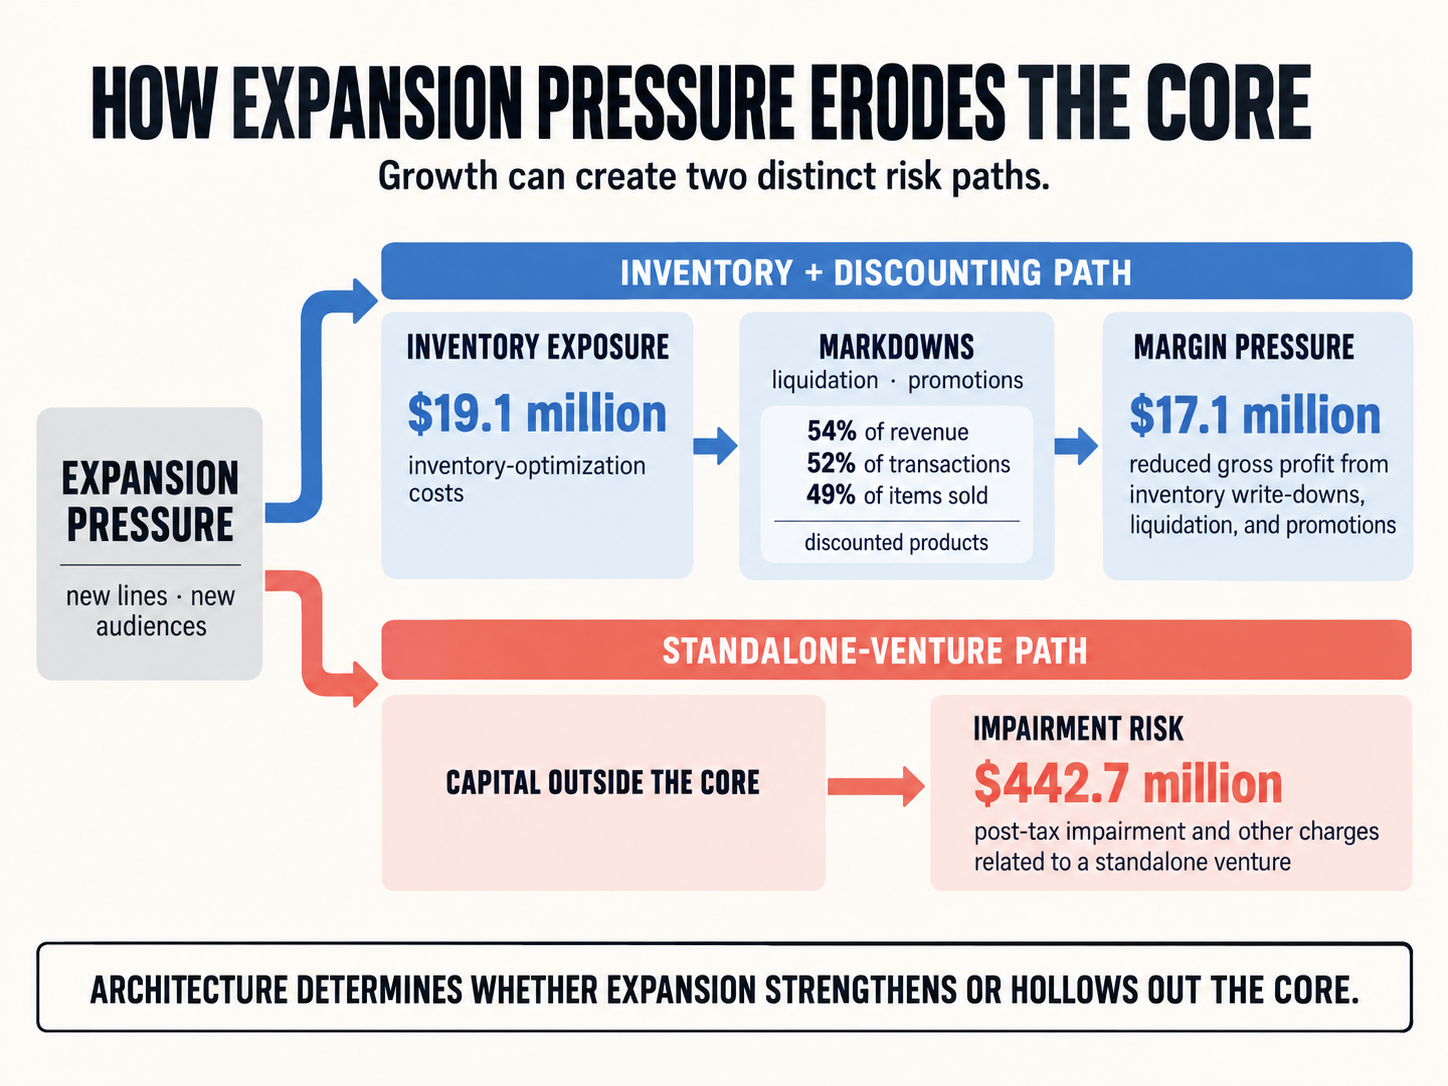
How Expansion Pressure Erodes the Core.
What the Cannibalization Data Shows
Naming architecture measurably changes how an extension affects the parent. In laundry detergent, extensions using sub-brands had a sales effect of β = −0.03, compared with β = 0.02 for extensions introduced under standalone brands [5]. This contrast suggests that how you name and frame an extension is not cosmetic; it shapes whether the new line pulls sales from the core.
The pattern repeats in adjacent categories. In toothpaste, extensions using sub-brands had a sales effect of β = −0.01, while extensions using standalone brands had a sales effect of β = 0.02 [5]. The direction is consistent across both categories, reinforcing that architecture choice, not just product quality, governs cannibalization risk.
Similarity between the extension and the parent matters too. Feature similarity had negative effects on focal-brand sales for sub-brand extensions across laundry detergent, coffee, and toothpaste, with β = −0.76, β = −2.61, and β = −0.10, respectively [5]. The larger the overlap in features, the greater the drag on the core under a sub-brand structure. For founders, this reframes the extension question from "can we build it" to "how close is it to what we already sell."
Adjacency That Adds Customer Value
Not all extensions erode the core; some deepen the customer relationship. Warby Parker net revenue increased 15.2%, active customers increased 7.8%, and average revenue per customer rose to $307 from $287 as contacts and eye exams complemented glasses purchases [2]. This shows adjacency working as intended: the new offering raised value per customer rather than splitting demand.
Category expansion can also outpace the core when it serves the same customer. On Holding reported that apparel sales increased 46.7% to CHF 101.0 million and accessories sales increased 49.5% to CHF 17.7 million, outpacing shoe growth of 28.5% to CHF 2,199.6 million [6]. The faster growth of adjacent lines signals headroom in categories the core customer already trusts. Yet the shoe base remained the largest revenue engine, a reminder that extensions grew from a protected core rather than replacing it.
Scale in adjacency is visible elsewhere too. YETI Drinkware net sales increased $71.2 million, or 7%, to $1,094.2 million as the company continued expanding and innovating its drinkware offerings, while YETI Coolers and Equipment net sales increased $101.1 million, or 17%, to $698.6 million, led by bags, soft coolers, and hard coolers [7]. Both categories grew in absolute dollars, showing adjacency compounding rather than cannibalizing.
Adjacency is not free of margin risk, however. Warby Parker gross margin decreased by 250 basis points in 2023, with growth in lower-margin contact lenses identified as a primary driver [2]. Even a value-adding extension can pull blended margin down when the new category carries a lower profit profile. Architecture decisions therefore need a margin lens alongside a revenue lens.
Why the Second Purchase Should Anchor Architecture
Retention data explains why breadth alone is a fragile growth strategy. Across 13 DTC brands observed for 720 days, 77% of customers bought once, while the ~23% who returned generated about 49% of revenue [8]. This concentration of revenue in repeat buyers means architecture should prioritize a credible second purchase over sheer assortment size.
The odds of repeat purchase compound with each transaction. Median conversion increased from 22.9% between the first and second purchases to 37.8% between the second and third and 48.2% between the third and fourth [8]. The rising conversion at each step shows that the hardest gap to close is the first-to-second purchase. An extension that helps a first-time buyer return is doing architectural work, not just adding a SKU.
Loyalty behavior reinforces the same point. Loyalty-program members spent 22% more per order, averaging £88 versus £72, and purchased 3.6 items per transaction, 38% more than the 2.6 items purchased by non-members [3]. The higher spend and basket size among members illustrate where architecture pays off: deepening the relationship with customers who already choose the brand.
How to Test Extensions Without Risking the Flagship
Before committing, evaluate a manageable set of moves rather than each brand decision in isolation. Develop and compare a small number of plausible scenarios that bundle compatible moves, keeping the count to no more than four or five so the organization and consumers are not overwhelmed [9]. Avoid evaluating brand moves separately, because repositioning one brand can ripple across others.
To size cannibalization before launch, run a concept test using both a direct substitution question and a purchase-allocation exercise. Ask consumers what they would buy instead if the new product did not exist, and separately capture their last ten and next ten purchases across the competitive set once the concept is introduced, employing both approaches as a best practice [10]. If the competitive set is unclear, defer the source-of-volume analysis to a later development stage rather than forcing an early read [10].
Once items are live, measure incrementality across the assortment instead of celebrating raw sales. Start by analyzing high-performing individual SKUs, then identify high and low cannibalization between on-shelf items using a bubble-chart visualization that combines sales, velocity, and incrementality in a four-quadrant view [11]. This keeps you from scaling a line that merely shifts demand within your own catalog.
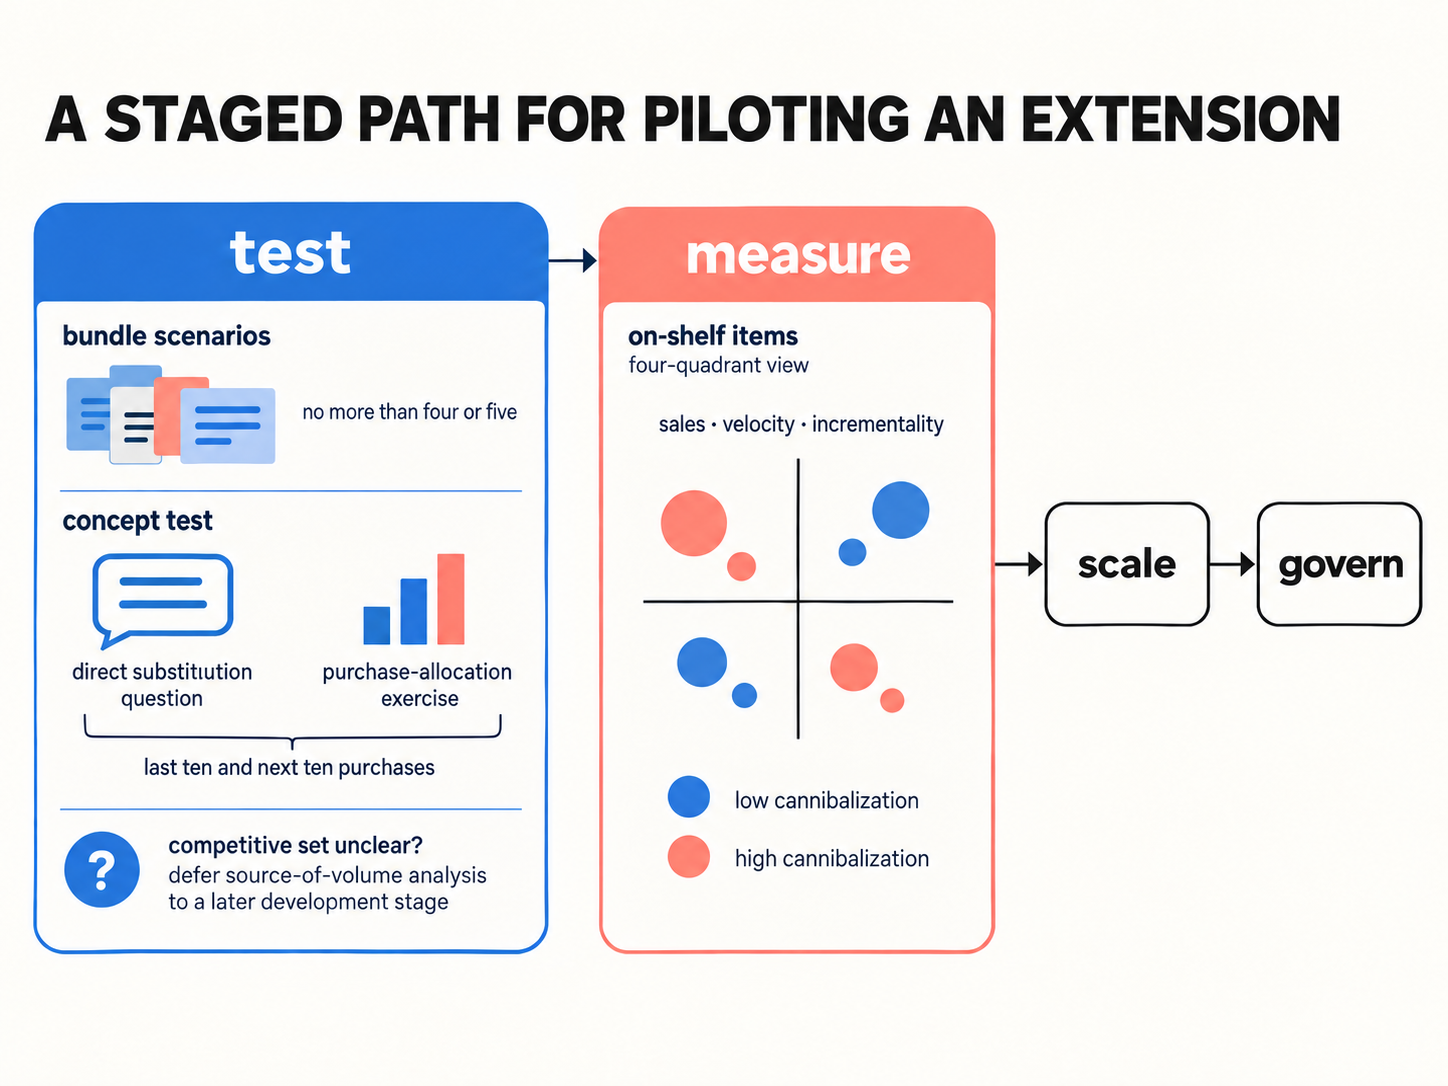
A staged path for piloting an extension: test, measure, scale, and govern.
Governance to Protect the Flagship
Judge a targeted extension by whether the intended customer returns to it. Treat strong repeat purchases as the key success indicator, since surviving targeted innovations had repeat rates in the top 25% of their category [12]. Set a repeat-rate threshold before launch and be willing to pull an extension that reaches an audience but fails to earn a second purchase.
Forecast across the full lifecycle, not only at launch, so you avoid overestimating growth or assuming endurance that isn't there. Use forecasting to assess whether a space is worth entering and its incrementality, prioritize the ideas with the strongest volume potential, and then track performance and adjust distribution, media, and pricing as needed [13]. Revisit early assumptions at each stage rather than treating the launch forecast as fixed.
Build a single view of performance so brands can be compared rather than tracked in isolation. Aim for centralized reporting of revenue, contribution margins, customer lifetime value, customer acquisition costs, and growth rate by brand, and plot each brand on a growth-versus-profitability matrix to decide which to invest in, maintain, or cut, according to Shopify [14]. When sequencing channel expansion, start with the brand that has the strongest product-market fit and margins to absorb upfront costs, use it as a test case, then roll that playbook to the next brand [14].
Protect the flagship by governing brand assets according to risk. Sort content into tiers based on risk, visibility, and frequency of use, and for each tier define what must stay locked, what can be edited locally, whether approval is required, who approves it, and which teams can access it, according to Marq [15]. Assign a portfolio manager with the authority, marketing skills, facts, and analyses to sway brand managers, supported by "swing" analysts who can be called up for major events such as a new-product launch [9]. Measure whether each brand is fulfilling its role using metrics for awareness, trial, consideration, conversion, retention in target segments, and satisfaction, with additional metrics tailored to each brand's strategic goals [9].
- Bundle compatible moves into no more than four or five scenarios instead of evaluating brands in isolation [9].
- Run both direct-substitution and purchase-allocation concept tests before launch [10].
- Map live SKUs on a bubble chart to separate incremental items from cannibalizing ones [11].
- Set a repeat-rate threshold and cut extensions that reach an audience but fail to earn a second purchase [12].
- Centralize reporting and plot brands on a growth-versus-profitability matrix to decide to invest, maintain, or cut [14].
- Tier brand content by risk and lock the highest-risk assets while allowing local edits elsewhere [15].
Conclusion
The through-line across these cases is that structure, not ambition, decides whether expansion strengthens or hollows out a brand. Extensions that stay close to the core customer and add value can lift revenue per customer and grow adjacent categories, while poorly framed or heavily discounted moves reset price expectations and drag on margin. Because repeat buyers concentrate so much of a brand's value, the smartest architecture protects the path to a second purchase rather than chasing breadth for its own sake. Governance, scenario testing, and honest incrementality measurement turn expansion from a gamble into a monitored experiment. So before you launch the next line, are you certain it will deepen the core customer's loyalty rather than quietly compete with it?
SUBMIT YOUR COMMENT